
Skip to content
Schedule an introductory meeting

Independent management consulting for general managers, boards and family business shareholders

Lasting changestarts with seeingthe whole.

  • Symptom
  • Mechanism
  • Root cause

In a company, the visible problem is rarely the real one. Our senior team uses SEFHA OHC™ to trace symptoms to their root cause and produces a clear diagnosis the board can decide on. If you wish, we then design the change and put it into practice together.

Schedule an introductory meeting Explore SEFHA OHC™

In the first meeting we talk about where your company stands today and what its priorities are.

Holistic Change Beyond Consulting

  • We have the same discussion in every meeting.
  • The reports get written, but nobody discusses them.
  • When that one person is away, everything stops.
  • Everyone tells a different story about this company.

The symptoms look alike; the causes differ in every company.

The real cause is usually hiding somewhere else.

Problems rarely start in a single function. Tension in one area shapes decisions in another. We name these tensions and strike the balance between them that fits the company's reality.

  1. Growth

    Speed vs. control

    Fast growth loosens control; tighten control and you lose speed.

  2. Governance

    Centre vs. delegation

    The more decisions gather at the centre, the weaker authority and ownership become in the field.

  3. Performance

    Effort vs. results

    Everyone works hard; how much of that effort turns into results stays invisible.

The future of the company and the generational handover for the shareholder, the quality of decisions for the general manager, reliable numbers for finance, an independent view for the board: all of them look at the same picture.

Everyone sees one link of the chain. We show the root cause beneath the symptoms, from the outside and with evidence.

We see the system, not just the parts.

The eight areas do not stand apart from one another. Management decisions are read through these connections, so we look at all eight together and put leadership at the centre.

  • Holistic
  • Systemic
  • Actionable

Click on an area: its connections light up and what we look at opens.

What we look at

Leadership

Governance, decision rights, management rhythm and delegation. All seven other areas connect to it.

Directly connected areasStrategy · Organization · Processes · Finance · Supply chain · Digital · Future

When one slips, the whole picture blurs; fixing a single area does not bring the picture back into focus on its own.

Diagnosis

SEFHA OHC™

Organizational health check

Examines how a company is managed across eight dimensions, and finds the mechanisms beneath the symptoms and the root cause that feeds them all. The outcome is a diagnosis the board can decide on and a prioritized roadmap.

Understand first. Then change.

As scattered accounts are tested against evidence, they come together in one clear picture.

  1. SSee the system

    We listen without prejudice to what management, the team and the field tell us.

  2. EExamine the evidence

    We test what we hear against documents and the field.

  3. FFind the gaps

    We find the gap between what is said and what actually works.

  4. HHarmonize the whole

    We trace how a decision in one area affects the others, and single out the critical levers.

  5. AAccelerate the change

    We build an implementation path with clear owners, timelines and measures.

What a management picture looks like

Illustrative example · not real company data

  • LeadershipcentreSaid 4.2, documented 3.4, actually works 2.6.
  • StrategySaid 4.0, documented 3.1, actually works 2.9.
  • OrganizationSaid 3.6, documented 3.3, actually works 3.0.
  • ProcessesSaid 3.8, documented 2.4, actually works 2.7.
  • FinanceSaid 3.9, documented 3.8, actually works 3.5.
  • Supply chain (red flag)Said 3.5, documented 2.9, actually works 1.8.
  • DigitalSaid 4.4, documented 2.2, actually works 2.0.
  • FutureSaid 3.7, documented 1.9, actually works 2.3.
  • Said
  • Documented
  • Actually works
  • Red flag

The further apart the dots, the blurrier the picture. The order is not the same on every row; a red flag does not get lost in the average.

  • 8dimensions; leadership at the centre
  • 304core questions
  • 95cross-check questions
  • 5maturity levels
  • 3management levels
  • Red flagpulls the score to the bottom and is tracked on its own list

We talk about patterns, not individuals.

Explore SEFHA OHC™

What is on your table at the end of the work.

SEFHA OHC™ is delivered not as a single document but as a set management can work with. At its centre are the diagnosis the board will decide on and a prioritized roadmap. The roadmap does not depend on implementing it with us.

SEFHA OHC™ delivery set: Organizational Health Report, Financial Structure Analysis, Workforce Structure Analysis, Action Handbook and Sector Note booklets
Delivery set: Organizational Health Report, letter to the shareholders, presentations, financial and workforce analyses, action handbook and tracking, sector note. Each document is a separate booklet.

AFTER SEFHA

And if you wish: implementation

The diagnosis is complete once the report is delivered. If you choose to walk the transformation with us, we build the implementation path together with your team and hand it over through training and mentoring. We call this work Management Rhythm.

The same table every month; how the month will close is visible before it ends.

Schedule an introductory meeting

In the first meeting we talk together about how clear the picture is today.

Direct Support

Deep dives where it matters.

If you already know the issue, we start right there. Every company's needs are different: one family business wants to talk about professionalization, another about growth. Once we have seen the whole, on request or in response to a specific need, we go deeper in the areas that will create real impact. We ask the right questions to gather the right data, and design solutions that work in practice.

01

Strategy & Performance

We examine in depth how strategy translates into targets, indicators (KPIs) and results.

Strategy architecture · KPI design · performance system · target setting

02

Organization & People

We analyse how well the organizational structure, roles and people are aligned with the company's goals.

Organization design · roles & responsibilities · competencies & development · change management

03

Governance & Decision Structures

We examine where decisions are made, how authority is distributed and how the management system actually works.

Corporate governance · board effectiveness · family protocol · authority & decision mechanisms

04

Process & Operations

We take a deep dive into end-to-end processes, bottlenecks, inefficiencies and operational performance.

Process improvement · bottlenecks · efficiency · operational excellence

05

Finance & Business Control

We examine how clearly the financial structure and business control mechanisms reveal the company's true economic performance.

Profitability · cash conversion cycle & working capital · cost structure · budgeting & management reporting

06

Supply Chain

We analyse demand, purchasing, inventory, planning and logistics as one integrated chain.

Demand & planning · purchasing · inventory · suppliers · logistics performance

07

Digital Transformation

We assess in depth the digital maturity of the business model and processes, not just the technology investments.

Digital maturity · process digitalization · data · system integration

08

Future Readiness

We examine how ready the company is for change, uncertainty and new conditions for growth.

Generational transition · succession planning · professionalization · scenarios & risk · growth

8 distinct areasOne holistic view.

With the HCBC approach we go deep where it is needed and always connect the findings back to the company as a whole.

We also offer seven hands-on training programmes and five mentoring programmes for your managers. Training & Mentoring →

Training & Mentoring

What you learn is on your desk Monday morning.

In-house management training and one-to-one executive mentoring, tailored to your company: seven hands-on training programmes and five mentoring programmes. All are led by HCBC partners, and every programme is built on real management decisions.

2 days
An interactive training workshop; it can also run as 1 day or 4 half days.
6 months
One-to-one mentoring; the executive brings the agenda.
3 partners
Trainers and mentors are HCBC partners who have made these decisions in their own chairs.

Which programme should you start with? In the first meeting we listen to your team and choose together.

Schedule an introductory meeting

Our team

Diverse expertise,
one whole.

Our team brings deep expertise in critical areas such as finance, sales, operations, human resources and organization, and looks at a company's problems not as separate pieces but as one connected whole.
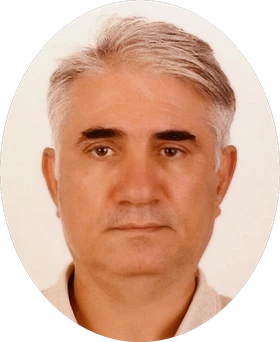
Cem Özkan
PARTNER CONSULTANT

Cem Özkan

Finance · Business Control · Supply Chain

Thirty years at four companies, leading finance, audit and supply chain.

As CFO and supply chain director, he brought budget and investment proposals to the board. At HCBC he leads finance, business control and supply chain.

30 years
in finance, audit and supply chain
4
companies

Companies

  • Participation Banks
  • Yıldız Holding
  • Mondi

Expertise

  1. Cash management · from receivables to working capital
  2. Profitability · from price to customer profitability
  3. Investment decisions · from feasibility to return
  4. Supply chain · from cost to service level
  5. Business control · from records to management rhythm
Hakan Arı
PARTNER CONSULTANT

Hakan Arı

Sales · Marketing · Operations

Twenty-six years at three international companies, rising from sales to general manager.

Alongside sales and marketing, he built experience in production, supply chain and finance. At HCBC he leads sales, marketing and operations.

26 years
in sales, marketing and general management
3
international companies

Companies

  • DS Smith
  • SCA
  • Mondi

Expertise

  1. Sales leadership · from the field to director
  2. General management · from targets to results
  3. Operations · from production to supply chain
  4. Planning · from valuation to purchasing
  5. Forecasting · from outlook to investment plan
Kaan Çağın
PARTNER CONSULTANT

Kaan Çağın

Human Resources · Organization

Thirty years at five companies, building and running human resources.

An expert in HR systems, union relations, talent and pay management. At HCBC he leads human resources and organization.

30 years
in human resources management
5
companies

Companies

  • Borusan
  • Sandoz
  • Polisan
  • Petrol Ofisi
  • Mondi

Expertise

  1. HR systems · from set-up to daily operation
  2. Union relations · from negotiation to agreement
  3. Talent and pay · from performance to reward
  4. Organization · from change to culture
  5. Growth phases · from investment to merger

We can't change tomorrow without seeing today clearly.

Let's meet to talk about where your company stands today, its critical tensions and its next stage.

First meeting
We talk about where your company stands today and what its priorities are. You set the agenda; the meeting carries no obligation.
Confidentiality
Findings are shared only with the management that commissioned the work; we talk about patterns, not individuals.
What we ask of your team
A single interview of no more than 150 minutes with each participant; opening and closing meetings of no more than 120 minutes each.
Afterwards
The diagnosis is complete once the report is delivered. If you wish, we also walk the implementation together.
Schedule an introductory meeting

Your email app opens with the subject filled in. Directly: info@hcbc.com.tr

Direct Support · 01

Strategy & Performance

The strategy is written; what changed on the ground?

Starting point
Introductory meetingWe clarify the need and the scope together.
Scope
As neededA single target system, or the whole strategy cycle.
Outcome
Decision reportRanked findings and recommendations.

A strategy document is drafted, approved by the board and then shelved by the daily routine. When inflation is high and priorities change every month, the link between targets and results weakens further. We look at where that link breaks: in which target, which indicator, which meeting.

The symptoms that bring companies to us

  1. 01

    There is a strategy document; by mid-year, teams no longer remember what it says.

  2. 02

    Everything is a priority: each department has its own list and the lists do not match.

  3. 03

    Dozens of indicators (KPIs) are tracked and none of them leads to a decision.

  4. 04

    Revenue targets are met thanks to inflation, while volume and profitability fall behind.

  5. 05

    Everyone hit their targets and bonuses were paid, yet the company is still behind plan.

  6. 06

    In the monthly meeting the numbers are read out; no one is named as owner of the gap or the next step.

Two starting points

If there is a strategy but no results

We identify where the strategy fails to connect to targets, indicators and daily work.

If you are preparing for a new period

Before planning begins, we check whether the target structure and tracking routine can carry the new strategy.

How it works

  1. SymptomPlans, reports and interviews: what was targeted, what is measured, what is discussed.
  2. MechanismThe decisions, meetings and incentives that turn targets into results: where the link breaks.
  3. Root cause and decisionRecommendations ranked by importance and urgency, each with an owner and a timeline.

The questions we answer

  • Has the strategy been reduced to a few clear priorities, or is everything a priority at once?
  • How do company targets cascade to departments, and do the parts add up to the whole?
  • Do the indicators (KPIs) you track produce decisions, or do they only fill reports?
  • Is growth real or driven by price? Are targets adjusted for inflation?
  • Do bonuses and rewards point the same way as where the company actually makes money?

Direct Support · 02

Organization & People

The chart is on the wall; who actually does the work?

Starting point
Introductory meetingWe clarify the need and the scope together.
Scope
As neededThe structure of a single unit, or the whole organization.
Outcome
Decision reportRanked findings and recommendations.

Companies are founded by people and grow through systems. When growth speeds up, a generation changes or a key person leaves, the chart on paper and the way work really flows drift apart. We look at where that gap begins: in which role, which authority, which transition.

The symptoms that bring companies to us

  1. 01

    The company has grown and the chart has not: today’s business runs on a structure from ten years ago.

  2. 02

    Job descriptions sit in a file; one task has two owners, another has none.

  3. 03

    The same person takes instructions from two managers, and the instructions conflict.

  4. 04

    The minimum wage rises every year; the gap between experienced staff and new hires keeps closing.

  5. 05

    When a good employee leaves, what they knew leaves too; no one is ready to step in.

  6. 06

    A change was announced and meetings were held; six months later everyone works the old way.

Two starting points

If the structure cannot carry the work

We identify where roles, authority and reporting lines diverge from the way work really flows.

If you are moving to a new structure

We check whether the organization, key roles and competencies can carry the next stage.

How it works

  1. SymptomCharts, job descriptions, pay and turnover data, interviews: what is written, what is lived.
  2. MechanismThe roles, authority and habits that steer the work: where the load builds up.
  3. Root cause and decisionRecommendations ranked by importance and urgency, each with an owner and a timeline.

The questions we answer

  • Does the structure follow the strategy, or has it formed around individuals?
  • Does every critical task have one clear owner, and do authority and responsibility sit in the same place?
  • Is the managers’ workload balanced, and how many layers does a decision pass through?
  • Does the pay structure protect fairness and motivation against inflation and minimum wage increases?
  • Do key roles have a back-up, and is development tied to a plan or left to chance?

Direct Support · 03

Governance & Decision Structures

Who makes the decision, and who holds them to account?

Starting point
Introductory meetingWe clarify the need and the scope together.
Scope
As neededA single question of authority, or the whole governance structure.
Outcome
Decision reportRanked findings and recommendations.

In a company where it is unclear where decisions belong, everything piles up on one desk: speed is lost, professional managers cannot use their authority, and the line between family and business blurs. We look at where decisions are really made: in written rules, in meetings, or in the corridor.

The symptoms that bring companies to us

  1. 01

    Even a small expense needs three signatures; urgent business slips away while it waits for approval.

  2. 02

    Board meetings are held for the minutes; the real decision is made over dinner.

  3. 03

    The CEO’s authority exists on paper; one call from a shareholder and the decision changes.

  4. 04

    A decision is reopened at the next meeting; no one is sure whether it was ever made.

  5. 05

    Being a family member is enough to hold a role in the company; roles, pay and dividends follow no written rule.

  6. 06

    Banks and investors ask about corporate governance; there is no record of what the board decides, and when.

Two starting points

If decisions pile up on one desk

Authority first: we map which decision sits with whom, where it gets stuck and what can be delegated.

If you are preparing to institutionalize

We check whether the board, the line between family and business, and the written rules can carry the transition.

How it works

  1. SymptomDocuments, meeting records and interviews: what the rules say, what practice shows.
  2. MechanismThe path a decision takes: who proposes, who approves, who follows up, and where it stalls.
  3. Root cause and decisionRecommendations ranked by importance and urgency, each with an owner and a timeline.

The questions we answer

  • Which decision belongs to whom? Do written authorities match actual practice?
  • Does the board set the company’s direction, or approve what has already happened?
  • Where is the line between ownership, the board and management, and where does the family stand?
  • Do meetings produce decisions, and are those decisions followed up?
  • Does the authority given to managers match the responsibility expected of them?

Direct Support · 04

Process & Operations

Everyone works hard; so why is the work always late?

Starting point
Introductory meetingWe clarify the need and the scope together.
Scope
As neededA single line or process, or the whole operation.
Outcome
Decision reportRanked findings and recommendations.

Labour, energy and financing costs are rising fast, and productivity is not keeping pace. A large share of installed capacity is lost to waiting, rework and unplanned stoppages; overtime hides this for a while, then returns as cost. We look at where work waits end to end, where it is repeated and whose desk it sits on.

The symptoms that bring companies to us

  1. 01

    There is overtime, yet orders are still late; shipments pile up at month end.

  2. 02

    The machines are there and capacity looks sufficient on paper, but the line stops often and changeovers and waiting take long.

  3. 03

    Scrap, returns and rework are treated as normal; no one knows what they cost.

  4. 04

    An order waits at every hand-off between departments; approval paperwork travels from desk to desk.

  5. 05

    Labour costs have risen sharply and cannot be passed on in price; there is no visible way to do the same work with fewer resources.

  6. 06

    When one person goes on leave the work stops; the process is not written down, it lives in people’s heads.

Two starting points

If cost pressure is rising

Losses first: we identify where time, material and labour are wasted, and where quick gains are possible.

If you are preparing to grow or invest

We check whether current processes can carry more volume, and what needs fixing before the investment.

How it works

  1. SymptomObservation on site, records and interviews: where work waits and where it is repeated.
  2. MechanismThe flow, decisions and habits that create delay and loss: where the problem starts.
  3. Root cause and decisionRecommendations ranked by importance and urgency, each with an owner and a timeline.

The questions we answer

  • How many days does the work take end to end, and how much of that is real work versus waiting?
  • Where is the bottleneck: in the machine, the people, the approval or the information?
  • How much of installed capacity creates value, and where is the rest lost?
  • What do scrap, rework and delays cost the company each year?
  • Are there a few indicators (KPIs) that show operations accurately, and are they discussed on the shop floor?

Direct Support · 05

Finance & Business Control

The profit is there; where is the cash?

Starting point
Introductory meetingWe clarify the need and the scope together.
Scope
As neededA single question, or the whole finance function.
Outcome
Decision reportRanked findings and recommendations.

Profit and cash are not the same thing. When interest rates are high and payment terms long, the gap widens: a company that earns on paper ends up financing its bank from the till. We look at where that gap begins: in which customer, which product, which decision.

The symptoms that bring companies to us

  1. 01

    Profit, but no cash: every month end starts with a look at the credit line.

  2. 02

    The more revenue grows, the more credit the business needs.

  3. 03

    Customer terms are 60 days in the contract and four to six months in practice; cheques go to factoring at steep discounts.

  4. 04

    It is not clear which product, which customer and which channel actually make money.

  5. 05

    The inflation-adjusted statements and the numbers management looks at do not match.

  6. 06

    The budget is shelved by mid-year; the management report arrives, but the meeting produces no decision.

Two starting points

If cash is tight

Cash first: we identify where receivables, inventory, terms and credit structure can bring quick relief.

If you are preparing to grow

We check whether profitability, cost structure and financing can carry the growth.

How it works

  1. SymptomStatements, documents and interviews: what is said, what is documented, what actually works.
  2. MechanismThe process, decision and habit that produce the number: where the problem starts.
  3. Root cause and decisionRecommendations ranked by importance and urgency, each with an owner and a timeline.

The questions we answer

  • Where is profit made and where is it lost? Product, customer and channel profitability.
  • How many days is the cash conversion cycle, and who is financing that time? Receivables, inventory, payables and working capital.
  • What does each day of payment terms cost the company, and does the price cover it?
  • Are budget and forecast a management tool, or a form filled in once a year?
  • Are currency, interest rate and payment-term risks tied to a written framework?

Direct Support · 06

Supply Chain

The warehouse is full; the item you need is not there.

Starting point
Introductory meetingWe clarify the need and the scope together.
Scope
As neededA single product group, or the whole chain from demand to delivery.
Outcome
Decision reportRanked findings and recommendations.

When interest rates are high, inventory is money sitting on a shelf; missing inventory is a lost order. As lead times lengthen, companies build stock as a precaution and then pay the interest on it. We look at where the chain breaks: in demand, in planning, in purchasing, in the warehouse or on the road.

The symptoms that bring companies to us

  1. 01

    The warehouse is full, but on shipping day the item you need is missing.

  2. 02

    Sales gives one number, production works to another; the plan is redone every week.

  3. 03

    Supplier lead times have lengthened; stock grew as a precaution and its interest comes out of cash.

  4. 04

    Purchasing chases the lowest price; another department pays for the delays, returns and rush orders.

  5. 05

    Freight and surcharges eat into profit before they reach the price; delivery dates promised to customers are missed.

  6. 06

    Slow-moving stock has sat on the same shelf for years; no one makes the decision to clear it.

Two starting points

If inventory and cash are tight

Inventory first: we separate where money is tied up from where service falls short, and identify quick relief.

If you are rebuilding the chain

Before a new supplier, warehouse or market, we check whether the chain can carry the load.

How it works

  1. SymptomInventory, order and delivery records, plus interviews on site: what is said, what is recorded, what actually works.
  2. MechanismThe decisions and habits behind the number: where the problem starts between demand, planning, purchasing and shipping.
  3. Root cause and decisionRecommendations ranked by importance and urgency, each with an owner and a timeline.

The questions we answer

  • How much money is tied up in inventory, and how much of it is forgotten stock rather than stock waiting to be sold?
  • Whose number is the demand forecast, and do sales, production and purchasing work to the same plan?
  • Does supplier selection weigh delivery, quality and payment terms alongside price?
  • How often is the delivery promise to customers kept (OTIF), and who pays when it is not?
  • Which critical items depend on a single supplier, a single route or a single currency?

Direct Support · 07

Digital Transformation

The system is in place; is the work still in Excel?

Starting point
Introductory meetingWe clarify the need and the scope together.
Scope
As neededA single process, or the whole systems landscape.
Outcome
Decision reportRanked findings and investment priorities.

Digital transformation is often reduced to a software purchase. Yet a system installed before the process is defined simply moves old habits onto a new screen; the data stays in spreadsheets and decisions are still made by guesswork. We look not at the technology but at how digitally the work itself runs: in which process, which data, which decision.

The symptoms that bring companies to us

  1. 01

    The ERP is installed, but the real work still runs in Excel spreadsheets.

  2. 02

    Sales, production and accounting give different numbers for the same thing.

  3. 03

    Collecting data for the month-end report takes days; by the time it arrives, the decision has already been made.

  4. 04

    The systems do not talk to each other; the same information is keyed in by hand in three places.

  5. 05

    AI was tried and stalled at the pilot; no one can say where it would create value.

  6. 06

    E-invoicing is in place, but approvals and follow-up still run on signatures, phone calls and reminders.

Two starting points

If the investment has not paid off

We identify which processes are not using the installed systems, and why the work drifts back to spreadsheets.

If you are about to invest again

Before a software or AI decision, we check whether processes, data and the team are ready for it.

How it works

  1. SymptomSystems, reports and interviews: what was installed, what is used, where the work really runs.
  2. MechanismThe processes that produce data, the hand-off points and the habits: where the disconnect starts.
  3. Root cause and decisionRecommendations ranked by importance and urgency, each with an owner and a timeline.

The questions we answer

  • Which critical processes run inside the system, and which run outside it?
  • How many hands does the number management looks at pass through, and whose number counts?
  • Which decisions did past investments speed up, and which did they not change at all?
  • Do data, responsibility and authority sit in the same place, and does every record have an owner?
  • Which processes and data must be put in order first for AI and automation?

Direct Support · 08

Future Readiness

Things are going well today; who leads in ten years, and with what?

Starting point
Introductory meetingWe clarify the need and the scope together.
Scope
As neededA single succession decision, or the company’s preparation for the next ten years.
Outcome
Transition roadmapRanked findings, recommendations and a timeline.

What brought the company to today is not always enough to take it into tomorrow. Rules kept in the founder’s memory, decisions gathered in one person and an unwritten plan for uncertainty stay invisible in good years. We look at how ready the company is for succession, change and new conditions for growth: who, under which rules, against which scenario.

The symptoms that bring companies to us

  1. 01

    The rules are not written down; everything lives in the founder’s memory and needs the founder’s approval.

  2. 02

    Succession is not discussed; when it is, the table turns tense.

  3. 03

    The next generation is not in the company, or it is unclear which seat they will take.

  4. 04

    Professional managers brought in from outside leave within a year or two.

  5. 05

    Growth has slowed; the old market is saturated and courage and resources are split over the new one.

  6. 06

    What to do in a currency shock, a rate hike or the loss of a major customer is only discussed on the day it happens.

Two starting points

If succession is approaching

We check whether management, ownership and the rules between family and business can carry the handover.

If growth and uncertainty are on the agenda

We assess the company’s resilience under different scenarios and its capacity to carry new growth.

How it works

  1. SymptomDocuments and interviews: what is discussed, what is written, what actually works.
  2. MechanismWhere decisions, authority and knowledge are concentrated: where the dependence begins.
  3. Root cause and decisionRecommendations ranked by importance and urgency, each with an owner and a timeline.

The questions we answer

  • Could the company run for a month without its founder today? Which decisions depend on one person?
  • Who is the successor, for which seat, and how are they being prepared for it?
  • Are the rules between family and business written down: how do joining, pay, ownership and exit work?
  • Do professional managers have defined authority, targets and a place to be held to account?
  • Is the downside scenario written down, and are the first moves clear in a currency, rate, demand or customer shock?

Training · 01

Finance for Non-Financial Managers

See the financial footprint of your decisions.

Duration
2 daysalso as 1 day or 4 half days
Participants
Sized to your teamwe agree the group size together
Method
Interactive workshopcase work, Excel calculations, group work
Trainer

A two-day hands-on programme for managers who do not come from finance. Participants read the income statement, balance sheet and cash flow statement using the figures of a fictional paint manufacturer, calculate the key indicators and see where their own units' decisions leave a mark on these statements.

After the programme, participants

  1. 01

    Reads the income statement step by step and explains, in their own words, the difference between gross profit, EBITDA, operating profit and net profit.

  2. 02

    Calculates how much money receivables, inventory and payables tie up on the balance sheet, in days (DSO, DIO, DPO).

  3. 03

    Builds the bridge from profit to cash and answers “we made a profit, so where is the money?” with figures.

  4. 04

    Spots red flags in profitability, liquidity, leverage and efficiency ratios.

  5. 05

    Maps three decisions of their own unit by their effect on the income statement, balance sheet and cash.

  6. 06

    Splits a budget variance into volume and margin effects and brings the right questions to the finance meeting.

The two days

Day 1

  1. The language of finance and the three statements
  2. Income statement: from sales to net profit
  3. Balance sheet: a snapshot of one day
  4. Cash flow: profit is not cash

Day 2

  1. Ratios and red flags
  2. The financial footprint of a decision
  3. Budget, variance and talking to finance
  4. Integrated case and close

Training · 02

Financial Decision-Making for Executives

Weigh profit, cash and investment at the same table.

Duration
2 daysalso as 1 day or 4 half days
Participants
Sized to your teamwe agree the group size together
Method
Interactive workshopcase work, Excel calculations, group work
Trainer

A two-day decision programme for managers who can already read financial statements. Participants assess the price cut, product exit, payment-term request, investment and scenario decisions on a fictional paint manufacturer's 2026 agenda through contribution margin, cash and risk; the programme closes with a role-played board decision meeting.

After the programme, participants

  1. 01

    Separates costs into fixed and variable; calculates contribution margin, break-even and operating leverage and uses them in decisions.

  2. 02

    Calculates the volume change a price cut or increase needs to keep profit unchanged.

  3. 03

    Calculates the incremental effect of dropping a product, customer or line without falling into the allocated fixed-cost trap.

  4. 04

    Calculates the cash and financing effect of payment-term, inventory and supplier decisions; anticipates the cash that growth will need.

  5. 05

    Assesses an investment proposal by net present value, internal rate of return and payback; tests assumptions with sensitivity analysis.

  6. 06

    Builds pessimistic, base and optimistic scenarios; sets early-warning indicators and decision thresholds.

The two days

Day 1

  1. Decision frame: profit, cash and risk
  2. Cost behaviour: contribution margin and break-even
  3. Price, volume and product decisions
  4. Cash and working capital decisions

Day 2

  1. Investment decisions: the time value of money
  2. Scenarios, sensitivity and early warning
  3. The board decision meeting
  4. Decision checklist and close

Training · 03

KPI Design and Performance Management

Manage the right behaviour with the right indicator.

Duration
2 daysalso as 1 day or 4 half days
Participants
Sized to your teamwe agree the group size together
Method
Interactive workshopcase work, Excel calculations, group work
Trainer

A two-day hands-on programme that rebuilds what a company measures, how it sets targets and how it reacts to variance. Participants prune a fictional logistics company's 64-indicator report, write indicator cards, set targets and thresholds, and build a one-page dashboard and a follow-up rhythm.

After the programme, participants

  1. 01

    Sorts the existing indicator list into outcome, leading and health indicators and removes duplicates and indicators with no owner.

  2. 02

    Builds a value tree from a company goal and chooses no more than 5–7 indicators for each layer.

  3. 03

    Writes an indicator card for each indicator with its definition, formula, data source, frequency, owner and threshold.

  4. 04

    Foresees the side behaviour an indicator will create and pairs it with a second indicator that balances it.

  5. 05

    Sets targets and red-amber-green thresholds from baseline, benchmark and capacity, and cascades targets to sub-units.

  6. 06

    Designs a one-page dashboard, tells normal fluctuation from a real signal and sets up a follow-up rhythm with an action log for variances.

The two days

Day 1

  1. Why indicators mislead
  2. From strategy to indicators: the value tree
  3. The indicator card: definition, formula, owner
  4. Side effects and balance

Day 2

  1. Setting targets and thresholds
  2. The dashboard and how to read it
  3. Follow-up rhythm: meeting, variance, action
  4. Adapting it to your company and a 30-day plan

Training · 04

Pricing, Margin and Commercial Performance in Sales

Manage price, margin and sales in one equation.

Duration
2 daysalso as 1 day or 4 half days
Participants
Sized to your teamwe agree the group size together
Method
Interactive workshopcase work, Excel calculations, group work
Trainers

Builds a shared commercial equation where sales wants volume, finance wants margin and management wants both. Participants work through the leakage from list price to pocket price, the volume a discount must earn back, customer and product profitability, and how a sales result splits into price, volume and mix effects. Over two days they work on the commercial decisions of a fictional water treatment company.

After the programme, participants

  1. 01

    Calculates, at the table and in five minutes, the effect of a price, discount or promotion offer on contribution margin and operating profit.

  2. 02

    Draws the waterfall from list price to pocket price for their own product and names the largest leak.

  3. 03

    Answers a discount request with “how many more units do we need to sell?”; compares the options for passing a cost increase on to price with figures.

  4. 04

    Reads customer and product profitability together with cost-to-serve; prepares a negotiation option for a loss-making customer.

  5. 05

    Splits the sales result into price, volume, mix and cost effects and runs the monthly commercial meeting with this bridge.

  6. 06

    Redesigns the discount authority matrix and the sales indicator (KPI) set so that they protect margin.

The two days

Day 1

  1. The commercial equation: volume, price, cost and margin
  2. The real price: from list price to pocket price
  3. The volume a discount must earn back, and pricing changes
  4. Setting prices and managing price increases

Day 2

  1. Customer and product profitability, with cost-to-serve
  2. Sales performance: the price-volume-mix bridge and sales indicators
  3. Pricing governance and the commercial performance rhythm

Training · 05

Purchasing, Inventory and Planning: Performance in the Supply Chain

Let inventory, purchasing and planning look at the same number.

Duration
2 daysalso as 1 day or 4 half days
Participants
Sized to your teamwe agree the group size together
Method
Interactive workshopcase work, Excel calculations, group work
Trainers

Teaches how to decide when sales says “keep everything in stock”, finance says “cut inventory” and purchasing says “let's buy in bulk”. Participants work on the cash language of inventory, forecast error, safety stock, order quantity, a supplier's total cost and sales and operations planning, using the figures of a fictional water treatment company. They end by building a management rhythm that tracks supply chain performance with a few indicators (KPIs).

After the programme, participants

  1. 01

    Talks about inventory in days, turnover and carrying cost; calculates the cash and profit effect of reducing inventory.

  2. 02

    Classifies materials with ABC-XYZ and proposes a different inventory and purchasing policy for each class.

  3. 03

    Measures forecast error and bias; separates the forecast from the target.

  4. 04

    Calculates safety stock, reorder point and order quantity together with the service level target; tests the real return of a bulk-purchase discount.

  5. 05

    Compares suppliers by total cost of ownership rather than unit price.

  6. 06

    Sets up the monthly sales and operations planning meeting and the supply chain indicator (KPI) set, including OTIF.

The two days

Day 1

  1. The end-to-end supply chain: service, cost and cash
  2. The language of inventory: categories, ABC-XYZ and slow movers
  3. Demand planning: forecast, error and bias
  4. Inventory policy: safety stock, reorder point and order quantity

Day 2

  1. Purchasing: total cost of ownership and supplier positioning
  2. Sales and operations planning (S&OP): balancing demand and supply
  3. Supply chain performance: indicators, OTIF and the management rhythm

Training · 06

Delegation, Authority and Decision Mechanisms in Management

Move the decision to the right level.

Duration
2 daysalso as 1 day or 4 half days
Participants
Sized to your teamwe agree the group size together
Method
Interactive workshopcase work, Excel calculations, group work
Trainers

A two-day hands-on programme on why decisions pile up at the top and at which level authority should sit. Participants build the decision inventory of a fictional manufacturing company, design its authority matrix, rehearse the delegation conversation, and leave with a 30-day delegation plan for their own unit.

After the programme, participants

  1. 01

    Classifies the decisions that reach their desk by impact and reversibility, and says at which level each should be taken and why.

  2. 02

    When delegating, discusses the expected result, limits, resources, level of delegation and checkpoints openly.

  3. 03

    Drafts an authority matrix for their unit with amount, risk and time thresholds.

  4. 04

    Notices work that is being pushed back up and hands it back to its owner.

  5. 05

    Separates decision meetings from information meetings and records each decision with its owner and date.

  6. 06

    Sets checkpoints and exception rules to follow a delegated decision without losing control.

The two days

Day 1

  1. Where do decisions get stuck?
  2. What delegation is and is not
  3. Types of decisions and the right level
  4. Designing the authority matrix

Day 2

  1. The delegation conversation and work pushed back up
  2. Decision mechanisms: meetings, records and escalation
  3. Following up without losing control
  4. Adapting it to my unit and a 30-day plan

Training · 07

Performance Systems, Organization and Competency Management

Build organization, competency and performance together.

Duration
2 daysalso as 1 day or 4 half days
Participants
Sized to your teamwe agree the group size together
Method
Interactive workshopcase work, Excel calculations, group work
Trainer

A two-day hands-on programme that builds organization structure, role definitions, the competency model and the performance appraisal process as one system. In a fictional logistics company that has grown fast, participants measure spans of control, write role and competency profiles, calibrate appraisal results and rehearse the performance conversation.

After the programme, participants

  1. 01

    Reads the organization structure through span of control, number of layers and role overlap, and compares structure options with their rationale.

  2. 02

    Writes a role definition made of purpose, areas of responsibility, decision rights, relationships and success measures.

  3. 03

    Builds a competency model of a few distinctive competencies described as behaviours, and writes their levels.

  4. 04

    Measures the competency gap between role and person and turns it into a development plan weighted towards on-the-job learning.

  5. 05

    Designs an appraisal process weighted on goals and competencies, recognises rating errors and runs the calibration meeting.

  6. 06

    Holds an evidence-based, future-focused performance conversation and handles difficult conversations.

The two days

Day 1

  1. Three mechanisms, one system
  2. Organization structure and span of control
  3. Role design
  4. The competency model

Day 2

  1. The gap between role and person, and development
  2. The appraisal process and calibration
  3. The performance conversation
  4. Connecting the system and a 30-day plan

Mentoring · 01

CEO & Senior Management Mentoring

In big decisions, someone who has sat in that chair is beside you.

Duration
6 months12 sessions of 90 minutes
Format
One-to-onealso as a first-100-days or peer-circle format
Agenda
The mentee brings itthe real work, that week’s issue
Mentors

A one-to-one programme in which general managers and senior executives discuss their own real agenda regularly, for six months, with a mentor who has sat in that chair. The mentee brings the agenda: a board presentation, an appointment in the top team, a budget negotiation, a major change decision. The mentor shares experience and views openly and leaves the decision to the mentee.

How the six months unfold

  1. 45 minIntroduction
  2. Month 1Start: agreement and opening three-way meeting
  3. Months 2–5Deepening: two sessions a month, mid-point review
  4. Month 6Close and closing three-way meeting
  5. +3 monthsFollow-up session

Topics most often brought to the table

  • Relations with the board and shareholders
  • Strategy and priorities: what to say no to
  • Building and leading the top team
  • Decision rhythm and delegation
  • Managing by the numbers: cash, profitability, budget
  • Crisis, bad news and difficult conversations
  • Leading in family businesses and shared ownership
  • Leading change
  • Their own time, energy and loneliness

After six months, the executive

  1. 01

    Sets the board agenda; takes decision options, not just information, to the board.

  2. 02

    Chooses the year's three to five priorities and says no, with reasons, to work outside them.

  3. 03

    Discusses roles, expectations and the weak link in the top team openly; makes a delayed appointment decision.

  4. 04

    Moves decisions to the right level and reduces the work piling up on their own desk.

  5. 05

    Takes bad news to the board and shareholders early, together with options.

  6. 06

    Divides their own time consciously between strategy, people and day-to-day work.

Mentoring · 02

Finance & CFO Mentoring

Discuss the finance chair's agenda with someone who knows that chair.

Duration
6 months12 sessions of 90 minutes
Format
One-to-onealso as a first-100-days or peer-circle format
Agenda
The mentee brings itthe real work, that week’s issue
Mentor

A one-to-one programme in which finance directors, heads of financial affairs and finance managers preparing for the CFO role discuss their own real agenda regularly, for six months, with a mentor who has sat in that chair. The mentee brings the agenda: a bank meeting, a budget going to the board, an auditor's finding, an argument over numbers with the general manager. The mentor shares experience and views openly and leaves the decision to the mentee.

How the six months unfold

  1. 45 minIntroduction
  2. Month 1Start: agreement and opening three-way meeting
  3. Months 2–5Deepening: two sessions a month, mid-point review
  4. Month 6Close and closing three-way meeting
  5. +3 monthsFollow-up session

Topics most often brought to the table

  • Decision partnership with the general manager and the board
  • Cash and working capital
  • Bank relations and financing
  • Budget, forecast and business control
  • Management reporting and profitability visibility
  • Currency, interest and inflation risks
  • Audit, tax and internal control
  • Investment and capital allocation
  • Building and transforming the finance team
  • Independence, pressure and saying “no”

After six months, the executive

  1. 01

    Takes not numbers but the decision options the numbers call for to the general manager and the board.

  2. 02

    Manages cash with a weekly view ahead; resolves working capital squeezes together with sales and purchasing.

  3. 03

    Builds relationships with banks in good times and talks to them without surprises, and with options, in bad times.

  4. 04

    Makes unit managers own their budget variances; updates the forecast regularly during the year.

  5. 05

    Protects the accuracy of the numbers under pressure; says “no”, with reasons and in time, where it is needed.

  6. 06

    Grows the finance team from closing and booking towards analysis and business support; prepares a successor.

Mentoring · 03

Sales & Commercial Management Mentoring

Discuss your commercial decisions with someone seasoned in the field.

Duration
6 months12 sessions of 90 minutes
Format
One-to-onealso as a first-100-days or peer-circle format
Agenda
The mentee brings itthe real work, that week’s issue
Mentor

A one-to-one programme in which sales directors and commercial managers discuss their own real commercial agenda regularly, for six months, with a mentor who has sat in that chair. The mentee brings the agenda: a price increase, a negotiation with a major customer, a change to the bonus system, an unprofitable customer or a quarter behind target. The mentor shares experience and views openly and leaves the decision to the mentee.

How the six months unfold

  1. 45 minIntroduction
  2. Month 1Start: agreement and opening three-way meeting
  3. Months 2–5Deepening: two sessions a month, mid-point review
  4. Month 6Close and closing three-way meeting
  5. +3 monthsFollow-up session

Topics most often brought to the table

  • Pricing decisions and price discipline
  • Discounts, pocket price and authority
  • Customer and product profitability
  • Key accounts and major negotiations
  • Building and leading the sales team
  • Targets, bonuses and indicators (KPIs)
  • Sales forecasting and balance with operations
  • Payment terms, collection and commercial risk
  • Channels, distributors and new markets
  • The commercial leader's position: management, finance and their own time

After six months, the executive

  1. 01

    Weighs price and discount decisions by their effect on profit as well as volume; gets the team asking “what does this discount buy us?” too.

  2. 02

    Plans, rather than postpones, passing cost increases on to price; goes to the customer with a rationale and options.

  3. 03

    Knows unprofitable customers and products by name; decides for each whether to grow, reprice or exit.

  4. 04

    Enters major negotiations having set their own limit, alternative and trade-off list in advance.

  5. 05

    Sets the sales team's targets, bonuses and indicators (KPIs) so that they also account for profit and collection.

  6. 06

    Discusses commercial decisions with the general manager, finance and operations on the same numbers; ties delivery promises to sales promises.

Mentoring · 04

People & Organization Leadership Mentoring

An experienced second pair of eyes on people and organization decisions.

Duration
6 months12 sessions of 90 minutes
Format
One-to-onealso as a first-100-days or peer-circle format
Agenda
The mentee brings itthe real work, that week’s issue
Mentor

A one-to-one programme in which human resources and organization leaders discuss their own real agenda regularly, for six months, with a mentor who has sat in this chair. The mentee brings the agenda: an organizational change, a pay-rise decision, a successor for a key role, a difficult meeting with the union, a disagreement with the general manager. The mentor shares experience and views openly and leaves the decision to the mentee.

How the six months unfold

  1. 45 minIntroduction
  2. Month 1Start: agreement and opening three-way meeting
  3. Months 2–5Deepening: two sessions a month, mid-point review
  4. Month 6Close and closing three-way meeting
  5. +3 monthsFollow-up session

Topics most often brought to the table

  • Partnership with the general manager and the top team
  • Organization structure and role design
  • Key roles, talent and succession
  • Performance and goal setting
  • Pay, benefits and allocating a limited budget
  • Growing management capacity
  • Employee relations, unions and difficult periods
  • HR's place in culture and change
  • People data and indicators
  • The HR leader's own position and team

After six months, the executive

  1. 01

    Takes people and organization matters to the general manager and top team in the language of business results, cost and risk; is involved in decisions from the start.

  2. 02

    Builds an organizational change around roles and decision flow, not people; plans the transition and the order of announcements.

  3. 03

    Draws up a realistic picture of key roles and their successors; knows which roles would stop the business if left empty, and acts on it.

  4. 04

    Differentiates a limited budget in pay and performance decisions with clear reasons, and gives managers defensible language.

  5. 05

    Runs the process fairly, quickly and on record in difficult periods such as downsizing, union negotiations or ethics complaints.

  6. 06

    Takes the first steps to turn their own team from a transaction-processing unit into one that supports managers.

Mentoring · 05

Transformation & Performance Mentoring

While you lead the change, someone who has walked that road is beside you.

Duration
6 months12 sessions of 90 minutes
Format
One-to-onealso as a first-100-days or peer-circle format
Agenda
The mentee brings itthe real work, that week’s issue
Mentors

A one-to-one programme in which the manager leading a transformation or performance improvement programme discusses their own real agenda for six months with a mentor who has led similar programmes. The mentee brings the agenda: a stalled project, a resisting unit, an indicator that is not moving, a status report due to management. The mentor shares experience and views openly and leaves the decision to the mentee.

How the six months unfold

  1. 45 minIntroduction
  2. Month 1Start: agreement and opening three-way meeting
  3. Months 2–5Deepening: two sessions a month, mid-point review
  4. Month 6Close and closing three-way meeting
  5. +3 monthsFollow-up session

Topics most often brought to the table

  • Defining the purpose and result of the transformation
  • Project portfolio: reducing and sequencing
  • Working with the sponsor and management
  • Reading resistance
  • Early, visible results
  • Tying the new way to daily management
  • Status reports and telling the truth
  • Balancing consultants, suppliers and the internal team
  • The strength and resilience of the person leading the programme

After six months, the executive

  1. 01

    Writes down clearly which result the transformation programme will show, by which date and with which indicator, and agrees on it with management.

  2. 02

    Reduces the number of projects running at once; decides, with reasons, to stop or restart one.

  3. 03

    Reads resistance: builds justified objections into the plan and overcomes resistance born of habit through ownership and visible results.

  4. 04

    Turns the status report from a list of green lights into an early account of risks and the decisions needed from management.

  5. 05

    Ties the new process to the daily management rhythm (meetings, indicators, targets) and prevents a return to the old ways when the programme ends.

  6. 06

    Manages their own energy and fatigue; stops being the programme's only carrier.